5 Min Read • January 4, 2022
How Video Affects ROI

Once dealerships started seeing the benefits of Service video, there was still one question that needed to be answered: what was the return on investment? So, TruVideo conducted further research to provide dealers — particularly those with low or medium adoption — with a delta report.
After comparing Customer Pay Repair Orders with and without video, the difference in labor dollars per RO and parts per RO was clear: good dealers who adopted video became great ones. This report became the single most important data point driving adoption, including among the most skeptical of dealers.
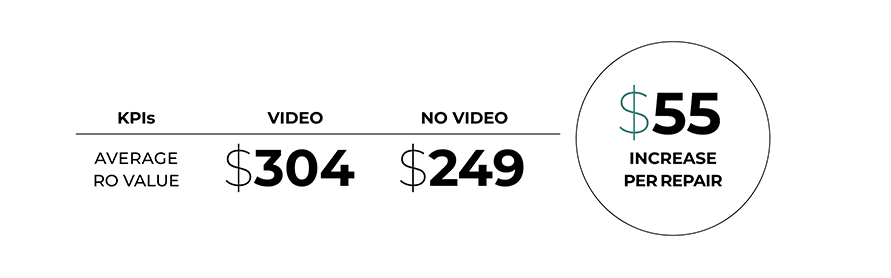
As we’ve seen in our previous article, Service videos can help dealers ring up more dollars per RO. But how much of an increase does this mean on average? One OEM partner shared that with a sample size of over 1,000,000 ROs, revenue grew by an average of $55 per repair. At the same time, customer satisfaction metrics also increased.
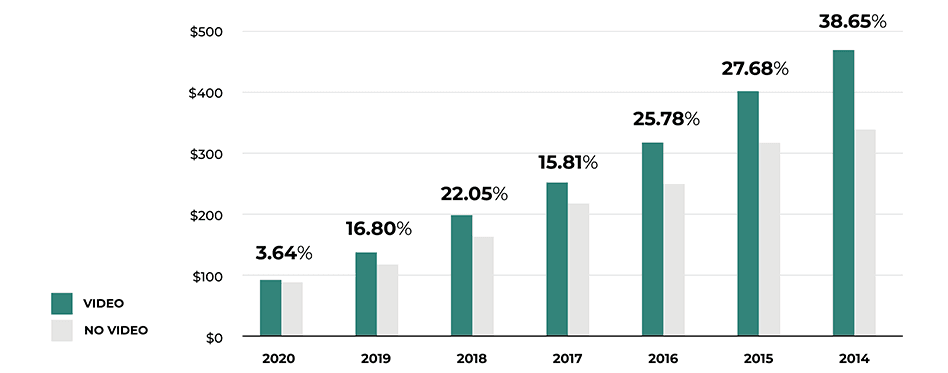
Additionally, ROI increased in direct relation to vehicle age — up to more than 38% for vehicles with model years of seven years prior. Data spans multiple brands and is based on results derived from 7,000,000 videos.
How Dealers and OEMs Measure Utilization
Utilization metrics are the most important measurements gauged by dealers and OEMs today. The reason is simple: the greater the amount of video communication produced, the better the dealer can provide a positive consumer experience (CX), grow revenue and generate data on which to build further success.
For dealers and OEMs who were early adopters, the first-generation unit of measurement was based on the standard communication trail: Videos Taken, Videos Sent and Videos Viewed. The results were encouraging from the start, so utilization began to increase.

As utilization grew, researchers began to identify metrics that could be established as benchmarks for average and “Best in Class” dealers. They quickly realized that the first benchmark had to precede the standard communication trail — before comparing Videos Viewed results to the number of Videos Taken, the optimal number of Videos Taken had to be formulated.
To arrive at that number, researchers had to look at Videos Taken as a percentage of total customer-facing Repair Orders (the sum of Customer Pay and Customer Warranty ROs).

The Videos Taken percentage was set at 75% of total ROs. Applied to 1,000 ROs, it produced the following:

By broadening their scope to look at Videos Taken as a percentage of total ROs, OEMS can now see the Videos Viewed rate in a larger context. Moving forward, researchers may find the optimal number of Videos Taken could remain at 75% or inch toward the 100% mark.
The Videos Viewed rate may be affected by such soft factors as how well Advisors prepare consumers to view videos after they’ve been sent. Video length may also play part.
Service Video Length Best Practices
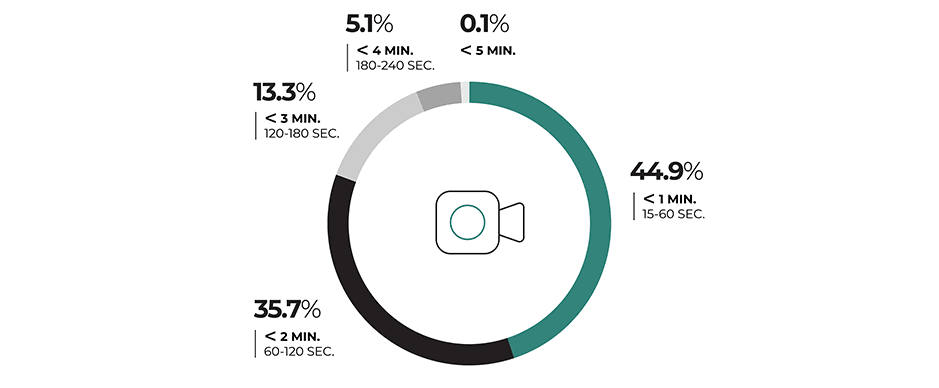
Best practices for Service video length suggest keeping each video short and to the point. Shorter videos are more likely to be viewed. And since they’re smaller and their files take less space, data can be transferred in less time.
As the chart below shows, the overwhelming majority of Service videos time out at two minutes or less — with nearly half of all videos at or below the one-minute mark.
In creating Service videos, Technicians should remember: the pause button is your friend. After videoing underneath the vehicle, pause the video while lowering the vehicle to eliminate unnecessary recording time; then, resume videoing to give the customer a look under the hood. This approach provides customers with a Service video that is detailed, concise and effective.
It is also a good idea for dealers producing video at higher volumes to establish a consistent process for technicians to follow. This increases efficiency and ensures more consistent results.
The Present and Future of Fixed Ops
Communication today is changing, with technology moving faster than ever. Customers are consuming content in more ways than before, and their expectations are evolving. All of this is creating an inflection point for businesses to create better consumer experiences, build trust and grow revenue.
We’ve seen unprecedented advances in video communication and texting. Service video usage is increasing rapidly — and it’s not slowing down.
Your customers’ experience is directly affected by the quality of your communication. By leveraging Service videos, every link in the communication chain is strengthened, resulting in faster approvals and more dollars per RO.
As research continues, new approaches will take shape to track results and measure effectiveness. Whether focused on view rates, video length, consumer feedback or other indicators, there will be more to learn as this type of communication becomes the norm.
One thing is clear: current findings show that Service videos are already driving dramatic increases in dealer revenue and CX. Every RO without video translates into reduced sales. For dealers who have been slow to adopt video communications, all research points to a single conclusion —
Maintaining success in Service depends on connecting with consumers through video now.
See how CDK ServiceView powered by TruVideo can improve your Service business HERE
Previous: Using Video to Drive the Customer Experience
About This Article
Contents of this article are adapted from the ROVI (Return On Video Investment) Report, which was compiled from research conducted by TruVideo. The leader in video communications for the transportation industry, TruVideo powers CDK ServiceView — where its insights derived from more than 7 million video views help increase consumer engagement and increase partner ROI and NPS.
Share This


